
Mind map
Upload a PDF or DOCX and get a structured map of its mechanisms, each linked to the sentence it came from. Uses your own Gemini API key.
Map a paperBioLayers SI connects biomedical literature, biological mechanisms, real microscopy, and cellular phenotypes into evidence-grounded maps for cancer research.
Every statement carries its source: a PubMed ID, a dataset accession, or a measurement you can check in the image yourself.
On 200 benchmark images, the segmentation model matched 22,212 hand-annotated nuclei with a pixel overlap (IoU) of 0.942. Read the validation report
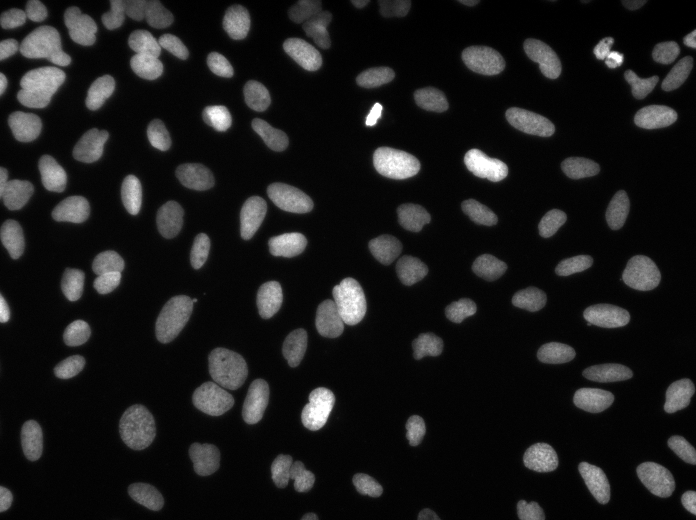
Nucleus 41
No flag raised. Whether it migrates or divides needs a time-lapse, not one frame.
Model score 0.96. This is Cellpose’s own confidence, not a calibrated error rate.
Mentors, partners and press behind BioLayers SI.
 Mentor
 Mentor
 Mentor
 Mentor
 Partner
 Partner
 Partner
 Partner
 Featured by
 AI BusinessFeatured byMentorMentorMentorMentorPartnerPartnerPartnerPartnerFeatured byAI BusinessFeatured by
Mentors are affiliated with these institutions as individuals. Listing does not imply institutional endorsement.
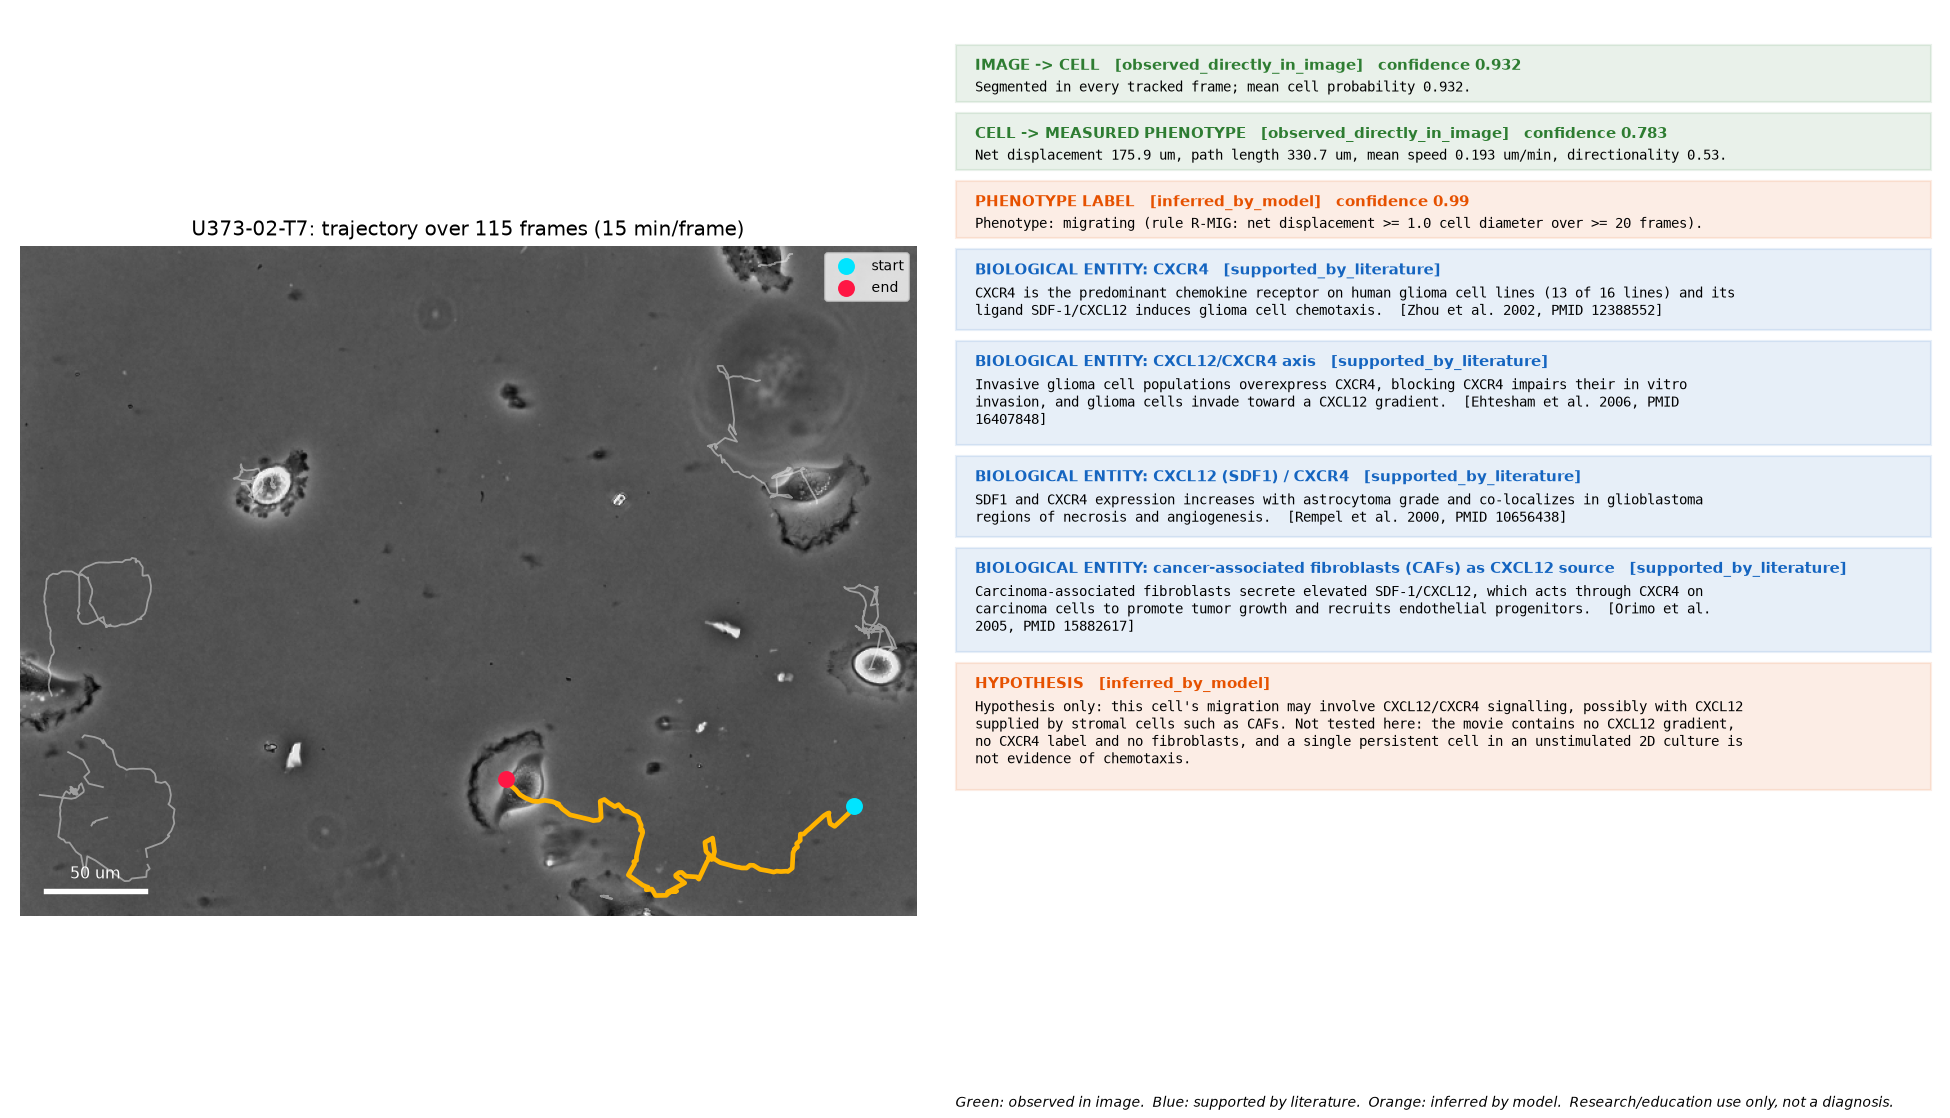
Our flagship case links a glioblastoma cell we tracked for 28.5 hours to the CXCL12/CXCR4 signalling axis. Each step shows where its evidence comes from, and the last link is a hypothesis, not a measurement.
Carcinoma-associated fibroblasts secrete elevated CXCL12, which acts through CXCR4 on carcinoma cells.
Shown in breast carcinoma, not glioma.
CXCR4 is the main chemokine receptor on 13 of 16 human glioma cell lines, and CXCL12 makes those cells move toward it.
Glioma cell lines and resected tumours, in vitro.
Invasive glioma cells overexpress CXCR4, and blocking it impairs invasion. CXCL12 and CXCR4 rise with tumour grade.
Glioblastoma cell U373-02-T7, tracked for 28.5 hours: 175.9 µm net displacement, 0.193 µm per minute, directionality 0.53.
What this does not show
We did not measure CXCR4 in this cell. Many cell stocks labelled U-373 are actually the line U-251 (Torsvik et al., 2014). The link from this cell to CXCR4 is a hypothesis the literature makes plausible.
Upload a PDF or DOCX and get a structured map of its mechanisms, each linked to the sentence it came from. Uses your own Gemini API key.
Map a paper634 catalogued microscopy records from the Broad Bioimage Benchmark Collection and the Cell Tracking Challenge, each with its source and licence.
Browse the atlasCause-and-effect maps of cancer pathways such as KRAS G12D resistance, readable in plain language or with full terminology.
Open CipherMind maps that other researchers have saved, newest first, with a page for each author.
Read the libraryNew to the biology? Take the 3D journey from a paper to a mechanism.
The cell atlas holds no AI-generated microscopy. Every record names its public dataset, accession and licence, and records we cannot verify are marked for review.
BioLayers SI started in Tashkent and is guided by oncologists and computational biologists. Featured by HundrED and AI Business.
Upload a PDF or DOCX. You get a map of its mechanisms, with the sentence each one came from.