
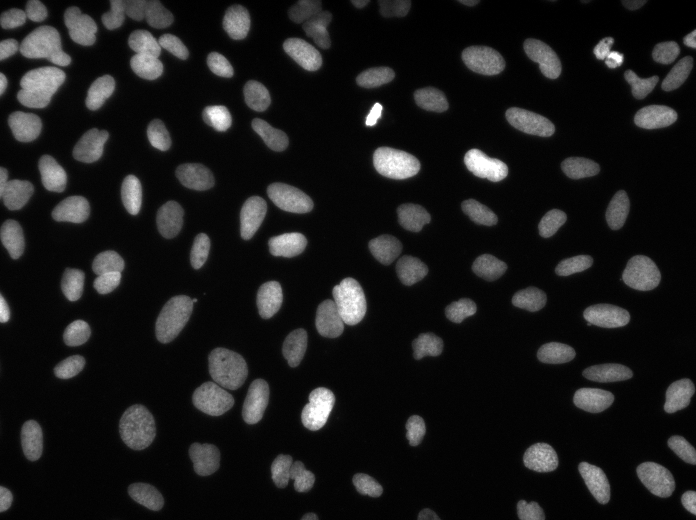
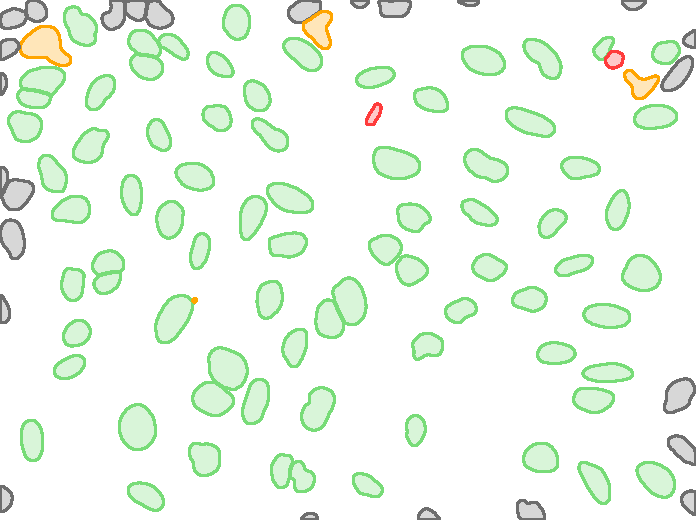
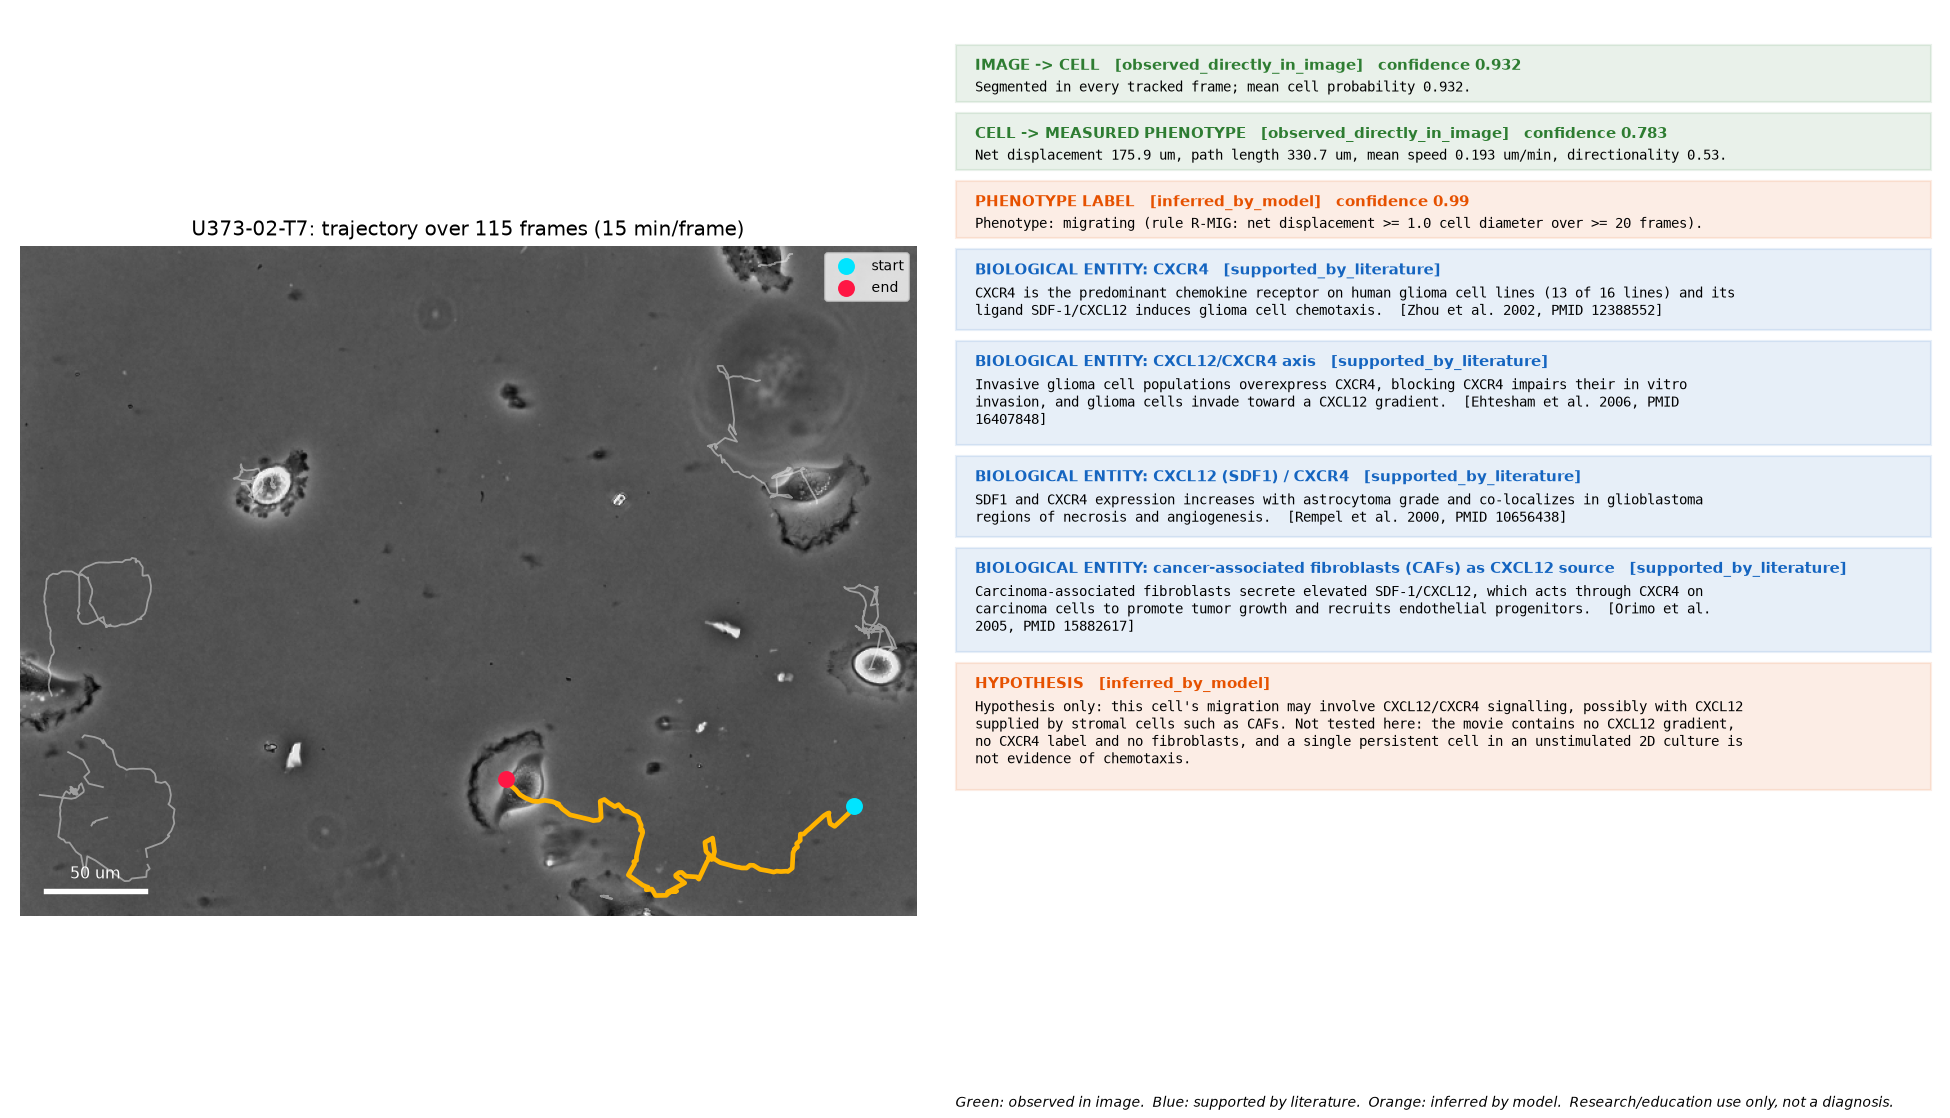
BioLayers SI takes a microscopy image or time-lapse, finds and outlines the cells, follows them over time, measures their shape and movement, assigns rule-based phenotype labels, and links the observed phenotype to published literature. It uses proven pretrained models; no model was trained for this release.
Models and versions
| Component | Model | Version | Confidence reported |
|---|---|---|---|
| segmentation | Cellpose, pretrained cpsam_v2 weights (zero-shot, no fine-tuning) | cellpose 4.2.1.1 | per cell: mean Cellpose cell probability inside the mask (uncalibrated, tends to saturate near 0.95-0.97) |
| tracking | BioLayers overlap tracker (Hungarian assignment on mask IoU + gap/flicker clean-up) | code 73984e8 | per track: mean IoU between the cell's masks in consecutive frames |
| phenotype rules | Rule-based phenotype classifier (transparent thresholds, not a learned model) | rules 0.1.0, code 73984e8 | per label: rule margin, the deciding feature's distance from its threshold mapped to 0.5-0.99 (not a probability) |
| literature linker | Curated knowledge base, manual curation (no text mining, no language model) | knowledge base 0.2.0 (2026-09-30) | not scored: each link cites the PubMed-verified paper it rests on |
Metrics
Segmentation, nuclei. BBBC039, 200 fluorescence images of U2OS nuclei with hand-annotated masks. Zero-shot (no fine-tuning). Objects matched at IoU >= 0.5.
| Pixel IoU | Pixel Dice | Precision | Recall | F1 | Correct / false / missed nuclei |
|---|---|---|---|---|---|
| 0.942 | 0.970 | 0.980 | 0.966 | 0.972 | 22,212 / 463 / 766 |
Segmentation and tracking, whole cells. Cell Tracking Challenge PhC-C2DH-U373, phase-contrast glioblastoma-astrocytoma cells, 2 sequences of 115 frames with ground-truth tracks.
| Sequence | SEG (mean Jaccard) | Detection precision | Detection recall | Link accuracy | Identity switches | Divisions found / real |
|---|---|---|---|---|---|---|
| 01 | 0.940 | 0.928 | 0.999 | 0.999 | 1 | 1 / 0 |
| 02 | 0.867 | 0.857 | 0.987 | 0.995 | 3 | 1 / 0 |
Phenotype measurement. 22,675 nuclei measured: area, perimeter, circularity, eccentricity, aspect ratio, solidity, intensity, texture. For tracked cells: migration distance, speed, directionality, division events. Nuclear/cytoplasmic ratio is not available (it needs two imaging channels).
Phenotype classification. Transparent threshold rules (version 0.1.0), not a trained model. On 22 tracked U373 cells: 4 abnormal morphology, 1 apoptotic/dead, 10 indeterminate, 10 migrating, 1 proliferating, 2 quiescent (a cell can carry several labels). There are no expert labels to score against. Indirect checks: 10 of 14 motility labels are unchanged when the rule is applied to the ground-truth trajectories; 86% of abnormal-morphology flags on BBBC039 are a single real nucleus, while 6.8% are merged nuclei (against 0.5% of unflagged nuclei).
Biological linking. Curated knowledge base (version 0.2.0): 5 papers, 4 phenotype-to-entity links, each statement checked against its PubMed abstract. Flagship case study: glioblastoma cell migration linked to the CXCL12/CXCR4 axis, with cancer-associated fibroblasts as a CXCL12 source.
Stability. The end-to-end demo completed in 6 of 6 release runs (cached masks and repeated fresh GPU segmentation).
| Sequence | Run | Status | Seconds | Cells | Compared with cached run | Flagship cell |
|---|---|---|---|---|---|---|
| 01 | cached | ok | 26 | 9 | reference | U373-01-T6 |
| 01 | fresh 1 | ok | 114 | 9 | identical | U373-01-T6 |
| 01 | fresh 2 | ok | 118 | 9 | identical | U373-01-T6 |
| 02 | cached | ok | 27 | 13 | reference | U373-02-T7 |
| 02 | fresh 1 | ok | 110 | 13 | identical | U373-02-T7 |
| 02 | fresh 2 | ok | 112 | 13 | identical | U373-02-T7 |
Evidence levels
Every statement the system makes carries exactly one level. They are never presented as equivalent.
| Level | Meaning |
|---|---|
observed_directly_in_image | Observed directly in the image (measured from segmented pixels) |
supported_by_literature | Supported by published literature (not observed in this image) |
inferred_by_model | Inferred by a model or rule (not an experimental fact) |
Limitations
- Public benchmark data only. No proprietary or patient data was used. The flagship case study runs on U373 cells as a stand-in; no A549 or fibroblast co-culture images were available.
- The biological link is a hypothesis for any individual cell. The images contain no CXCL12, CXCR4 or fibroblast signal. Literature describes the cell type and pathway in general.
- Phenotype labels are unvalidated rules. No expert-labelled cells exist to measure their accuracy.
- Division detection is unvalidated. The benchmark sequences contain no real divisions, and the detector reports one false division per sequence, so 'proliferating' labels on this data are false positives.
- Abnormal-morphology flags include segmentation errors (merged touching nuclei) as well as real shapes.
- Tracking metrics are our own implementation of the Cell Tracking Challenge definitions, not the official evaluation software, and are not comparable to its leaderboard.
- Measured speeds are about 12% below ground truth (mask centroids versus hand-placed markers).
- Two datasets, two cell lines. Performance on other stains, magnifications and cell types is unmeasured.
- Confidence values are not calibrated probabilities. Cell probability is the model's own score; rule margin is a distance from a threshold.
- Cell line identity. Many stocks labelled U-373 are U-251 (Torsvik et al. 2014, PMID 24810477).
Licences and data sources
- Cellpose code: BSD-3-Clause. The Cellpose project states that all its pretrained models are trained on data licensed CC-BY-NC (non-commercial). Commercial use needs a licence review first.
- BBBC039: Broad Bioimage Benchmark Collection, CC0.
- PhC-C2DH-U373: Cell Tracking Challenge training data, used under the challenge's terms with citation.
Reproduce
python src/benchmark_phase1.py(segmentation benchmark)python src/track_phase2.py(tracking benchmark)python src/run_case_study.py(phenotype labels, literature links, model cards)python src/demo.py(end-to-end demo on the flagship time-lapse)